Great Graphic|Phân kỳ giữa Châu Âu và Mỹ

by finandlife03/09/2014 15:01

Biểu đồ này được cập nhật bởi Bloomberg, cho thấy chỉ số PMI sản xuất của Mỹ (đường màu trắng) có một sự phân kỳ rõ ràng so với chỉ số PMI của Châu Âu (đường màu vàng).

Biểu đồ bên dưới cho thấy tốc độ lạm phát của Mỹ (đường màu trắng) có xu hướng tăng và cao hơn rất nhiều so với Châu Âu (đường màu vàng).
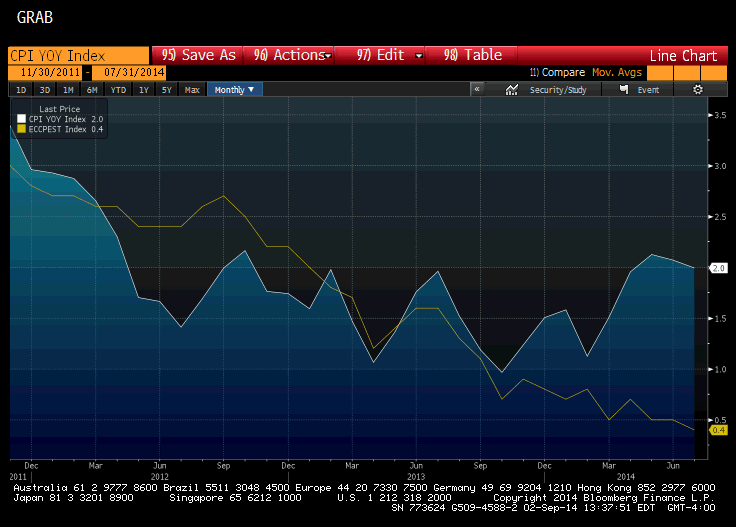
 

Điều này cho thấy áp lực giảm giá đồng Euro cao hơn so với USD. Những hợp đồng xuất khẩu của Việt Nam vào 2 thị trường này nên chốt theo USD sẽ có lợi hơn so với Euro.


Nguồn: finandlife|marctomarket.com

Tags:

Economics

DISCLAIMER

I am currently serving as an Investment Manager at Vietcap Securities JSC, leveraging 16 years of experience in investment analysis. My journey began as a junior analyst at a fund in 2007, allowing me to cultivate a profound understanding of Vietnam's macroeconomics, conduct meticulous equity research, and actively pursue lucrative investment opportunities. Furthermore, I hold the position of Head of Derivatives, equipped with extensive knowledge and expertise in derivatives, ETFs, and CWs.


To document my insights and share personal perspectives, I maintain a private blog where I store valuable information. However, it is essential to acknowledge that the content provided on my blog is solely based on my own opinions and does not carry a guarantee of certainty. Consequently, I cannot assume responsibility for any trading or investing activities carried out based on the information shared. Nonetheless, I wholeheartedly welcome any questions or inquiries you may have. You can contact me via email at thuong.huynhngoc@gmail.com.


Thank you for your understanding, and I eagerly anticipate engaging with you on topics concerning investments and finance.

Designed by: Nguyễn Chí Hiếu